AI Broke the Automation Payback Calculation

TL;DR: AI has also sped up tooling development, from weeks to hours, breaking the automation economics calculations that held for decades.
This quick minute read is for teams still manually fighting workflow friction instead of investing in solutions to smooth the path.
In this post, I'll explain why and how things have changed, and give you 3 real world examples.
- biome-suppressed - Moving to Biome without the multi-week refactor (30 minutes)
- Git stats - Measuring AI adoption through git analysis (5 minutes)
- Custom DORA reporting - Team velocity tracking with custom HTML reporting (few hours)
You can also expect some fantastic XKCD sketches I've borrowed to support to make my point, and, as always, I'll challenge you to try out some tool making for yourself.
I wanted something which didn't exist yet
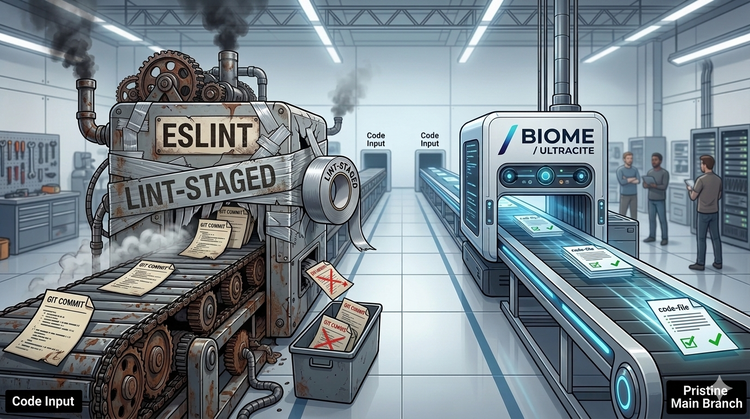
We wanted to upgrade from ESLint to Biome. Speed upgrade plus stricter rules from Ultracite sounded perfect. Except we knew from experience this was a multi-week effort, maybe months. Fixing straggling bugs, making compromises, turning off rules we couldn't immediately satisfy.
ESLint's new bulk suppression feature would've been ideal for this exact situation—accept current errors, enforce rules on new code only. But Biome didn't have it.
So we built it... In 30 minutes... more on this later. First:
The two XKCDs that explain everything
The General Problem
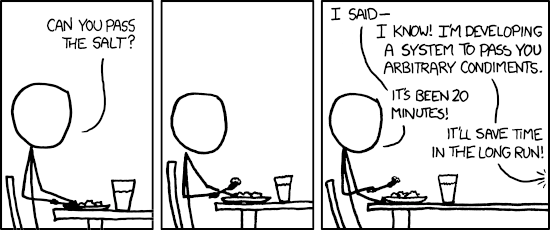
XKCD 974 perfectly captures the old trap: "I could spend 5 minutes doing this manually, or spend all day automating it." Then you spend all day, plus debug time, plus maintenance.
This used to be genuine wisdom. Automation was expensive. Building custom tools required deep expertise, significant time investment, and ongoing maintenance burden. The ROI calculation rarely made sense for one-off or team-specific problems.
That calculation has now changed.
The Payback Grid
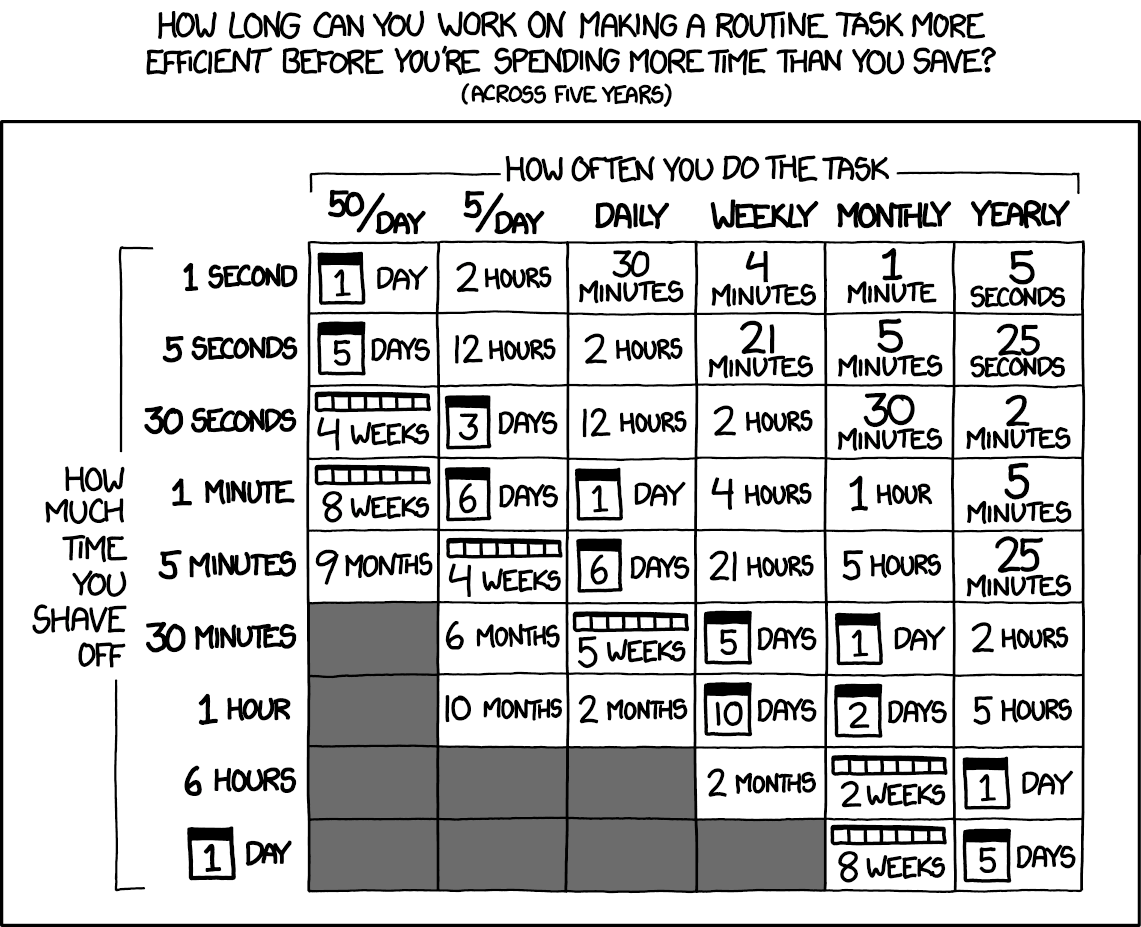
XKCD 1205 shows the classic automation payback grid. It answers: "How much time can you spend automating this task before you're losing time over a 5-year period?"
The grid is still mathematically correct. The difference is that the time investment to build these tools dropped from weeks to hours, sometimes minutes. What required a 5-year payback period to justify now pays back in months.
See the appendix for 1-year and 2-year versions of this grid. Built with AI, naturally.
What this actually looks like
biome-suppressed: 30 minutes to published tool
 a-c-m
a-c-mWe really wanted Biome's speed. Orders of magnitude faster than ESLint on our codebase. And we wanted to adopt Ultracite's AI-powered linting rules—much more aggressive, catching patterns traditional linters miss.
But we'd been down this road before. Upgrading linters on a large codebase means:
- Weeks fixing violations in legacy code
- Compromises: disabling rules that are "too strict"
- Bugs introduced while refactoring to satisfy new rules
- Team friction over what to fix now vs. later
ESLint's new suppression feature solved this elegantly. Run the linter, accept current errors, ignore them in future runs. New code follows new rules, legacy code gets fixed gradually. Perfect.
Biome didn't have this feature.
Traditional approach: wait for the feature, or stick with slow tooling, or commit to the multi-week refactor.
AI approach: 30 minutes with Claude, working prototype.
We built biome-suppressed, a wrapper that sits above Biome and provides the same suppression workflow. Tested it locally for a few weeks, fixed issues, refined the implementation. Now it's published, anyone can use it.
https://www.npmjs.com/package/biome-suppressed
The result: we adopted Biome's speed and Ultracite's aggressive rulesets without the massive refactor. New code meets high standards, legacy code doesn't block progress.
Git stats: 5 minutes to weekly reference
 262588213843476
We wanted to measure AI adoption within our team. One metric: commits and lines of code changed. Yes, I know, terrible metric for quality. But for measuring AI impact on output? Actually quite useful.
Traditional approach: manually run git log, parse output, track in spreadsheet, compare week-over-week.
AI approach: asked an agent to write a script. Five minutes later, working tool.
The script analyzes git history, counts commits and lines changed by developer, compares to previous weeks. We use it every week. Short Ten-minute investment, ongoing value, but also deeper conversations about adoption patterns we wouldn't have had otherwise.
Whats been an added bonus, was to feed the results of this script into an AI for its own insights, as part of our weekly retrospective!
Custom DoraMetrics: few hours to ongoing optimization
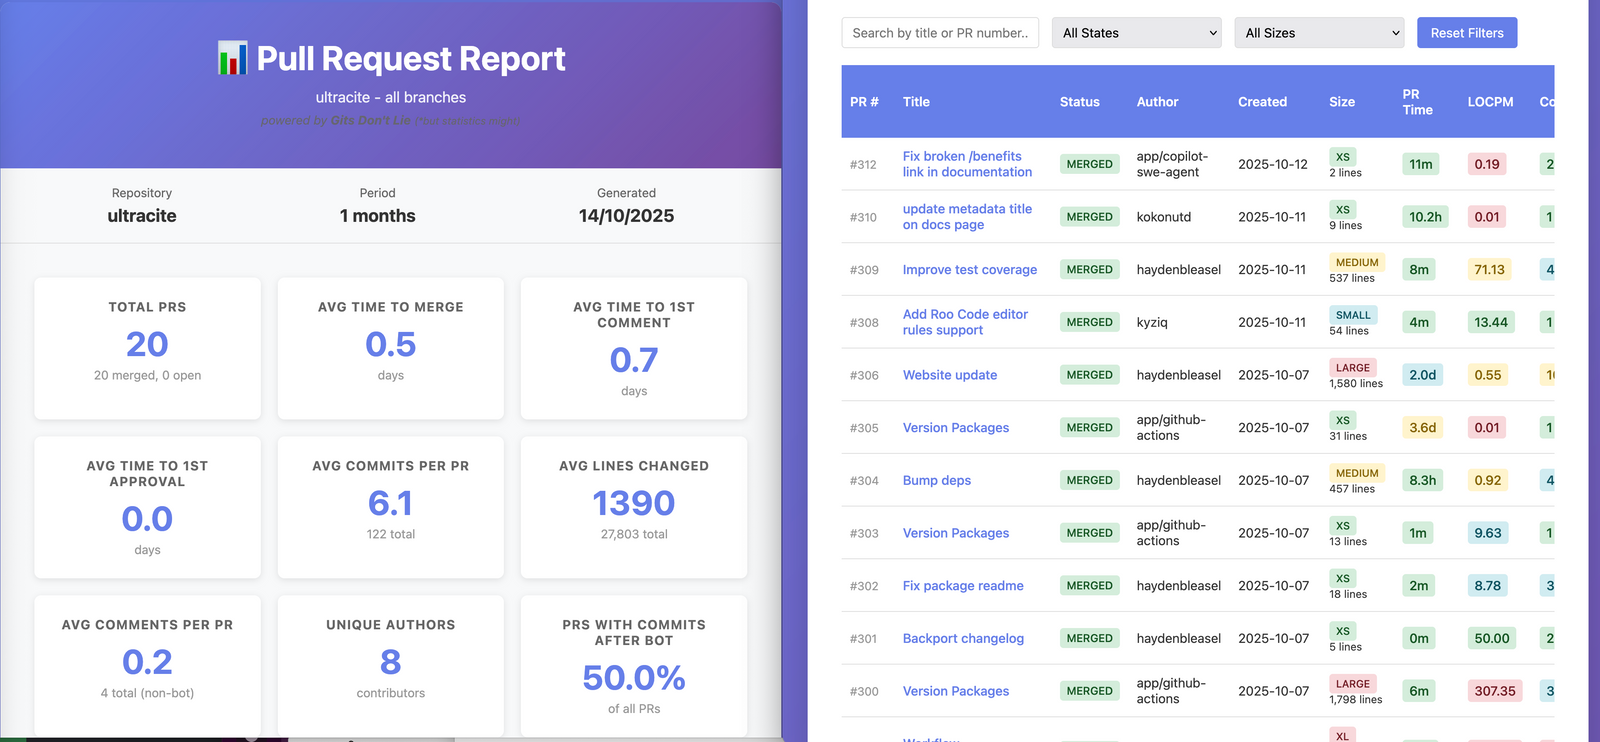
We wanted to evaluate team velocity using DORA for some quarterly reviews. Tools like LinearB exist and are great, but we needed specific customizations for our reporting needs.
Traditional approach: pay for tool, export data, customize in spreadsheets, repeat quarterly.
AI approach: few hours with Claude building a custom analyzer.
It analyzes git history, examines open and closed branches, generates reports with filtering, sorting, and graphing. The resulting data gave us talking points to both start optimization and monitor progress over time.
This one I haven't released publicly yet. Depending on interest, might release as a product or make available on request.
The Jevons Paradox of tooling
Jevons Paradox is an economic theory that when technology improves the efficiency of resource use, overall consumption often increases rather than decreases. Greater efficiency lowers costs, leading to higher demand.
The same thing happens with custom tooling.
When building tools becomes cheaper, you build more tools. But it's not just quantity—the tools unlock workflows you didn't anticipate.
The git stats tool wasn't just about measurement. It changed the conversations we had about AI adoption. Having weekly data visible shifted discussions from "are we using AI?" to "why did velocity spike here?" and "what patterns correlate with impact?"
Data visualization that was "too expensive" becomes standard. Custom dashboards appear for team-specific needs. The tool's existence creates new opportunities.
The team structure question
Not everyone needs to shift their mindset to tool-making. But someone should be asking the question.
Here's what I'm seeing: managers are doing software development again. AI coding agents lowered the barrier enough that engineering managers—who often haven't written production code in years—are building tools for their teams.
They're actually the perfect candidates for this. They have the broader scope. They see workflow friction across multiple developers. They understand team-wide pain points. When they invest 30 minutes building a tool, it often applies to 5-10 people, not just themselves.
The multiplication effect here is substantial. A manager who understands both the team's needs and has the technical ability to quickly prototype solutions can have outsized impact. They're not necessarily writing production features, but they're building the tooling that makes their team more effective.
Someone asks: "Can I make solving this problem easier now and in the future?" instead of just "How do I solve this problem now?"
The multiplication effect compounds. A 30-minute investment in biome-suppressed unblocked weeks of potential linting migration work across multiple projects. A 5-minute git stats script influenced quarterly planning discussions. The benefits cascade.
Try this next
Pick one workflow annoyance this week:
- Something you do repeatedly
- Something that frustrates you
- Something manual that feels "not worth automating"
Spend 30 minutes with an AI agent building a tool to solve it.
Then track two things:
- Did you use it again?
- Did it unlock something unexpected?
My bet: both answers are yes. And even if its not, you've only invested an hour or two, not weeks in the learning.
---
Appendix: XKCD 1205 for shorter timeframes
I've always wanted to know what these payback periods looked like for 1-year and 2-year windows, but never had the time to calculate them. Ironically, AI helped me create these very quickly, and I'll now have this as a reference for all the future times I bring up this particular XKCD.
2-Year Payback Period
| Fequency vs Time saved per task | 50x/day | 5x/day | 1x/day | 1x/week | 1x/month | 1x/year |
|---|---|---|---|---|---|---|
| 1 second | 10 hours | 1 hour | 12 minutes | 1.5 minutes | 24 seconds | 2 seconds |
| 5 seconds | 2 days | 5 hours | 1 hour | 9 minutes | 2 minutes | 10 seconds |
| 30 seconds | 2 weeks | 1 day | 6 hours | 52 minutes | 12 minutes | 1 minute |
| 1 minute | 3 weeks | 2.5 days | 12 hours | 1.5 hours | 24 minutes | 2 minutes |
| 5 minutes | 4 months | 2 weeks | 2.5 days | 8.5 hours | 2 hours | 10 minutes |
| 30 minutes | 2 years | 2.5 months | 2 weeks | 2 days | 12 hours | 1 hour |
| 1 hour | 4 years | 5 months | 1 month | 4 days | 1 day | 2 hours |
| 6 hours | — | 2 years | 6 months | 3.5 weeks | 1 week | 12 hours |
| 1 day | — | — | 2 years | 3 months | 1 month | 2 days |
1-Year Payback Period
| Fequency vs Time saved per task | 50x/day | 5x/day | 1x/day | 1x/week | 1x/month | 1x/year |
|---|---|---|---|---|---|---|
| 1 second | 5 hours | 30 minutes | 6 minutes | 52 seconds | 12 seconds | 1 second |
| 5 seconds | 1 day | 2.5 hours | 30 minutes | 4.5 minutes | 1 minute | 5 seconds |
| 30 seconds | 1 week | 15 hours | 3 hours | 26 minutes | 6 minutes | 30 seconds |
| 1 minute | 1.5 weeks | 1 day | 6 hours | 52 minutes | 12 minutes | 1 minute |
| 5 minutes | 2 months | 1 week | 1 day | 4.5 hours | 1 hour | 5 minutes |
| 30 minutes | 1 year | 1 month | 1 week | 1 day | 6 hours | 30 minutes |
| 1 hour | 2 years | 2.5 months | 2 weeks | 2 days | 12 hours | 1 hour |
| 6 hours | — | 1 year | 3 months | 1.5 weeks | 3 days | 6 hours |
| 1 day | — | — | 1 year | 7 weeks | 2 weeks | 1 day |
Key insight: A daily task that saves 5 minutes justifies spending 1 full day building automation (1-year payback). With AI, you can build that automation in hours, not days.